Enterprise Solutions
Enterprise Workflow
Automation Dashboard
Design and development of a unified operational dashboard and automated engine. The platform connects content operations, request management, and real-time status tracking to give leaders complete transparency over delivery cycles.
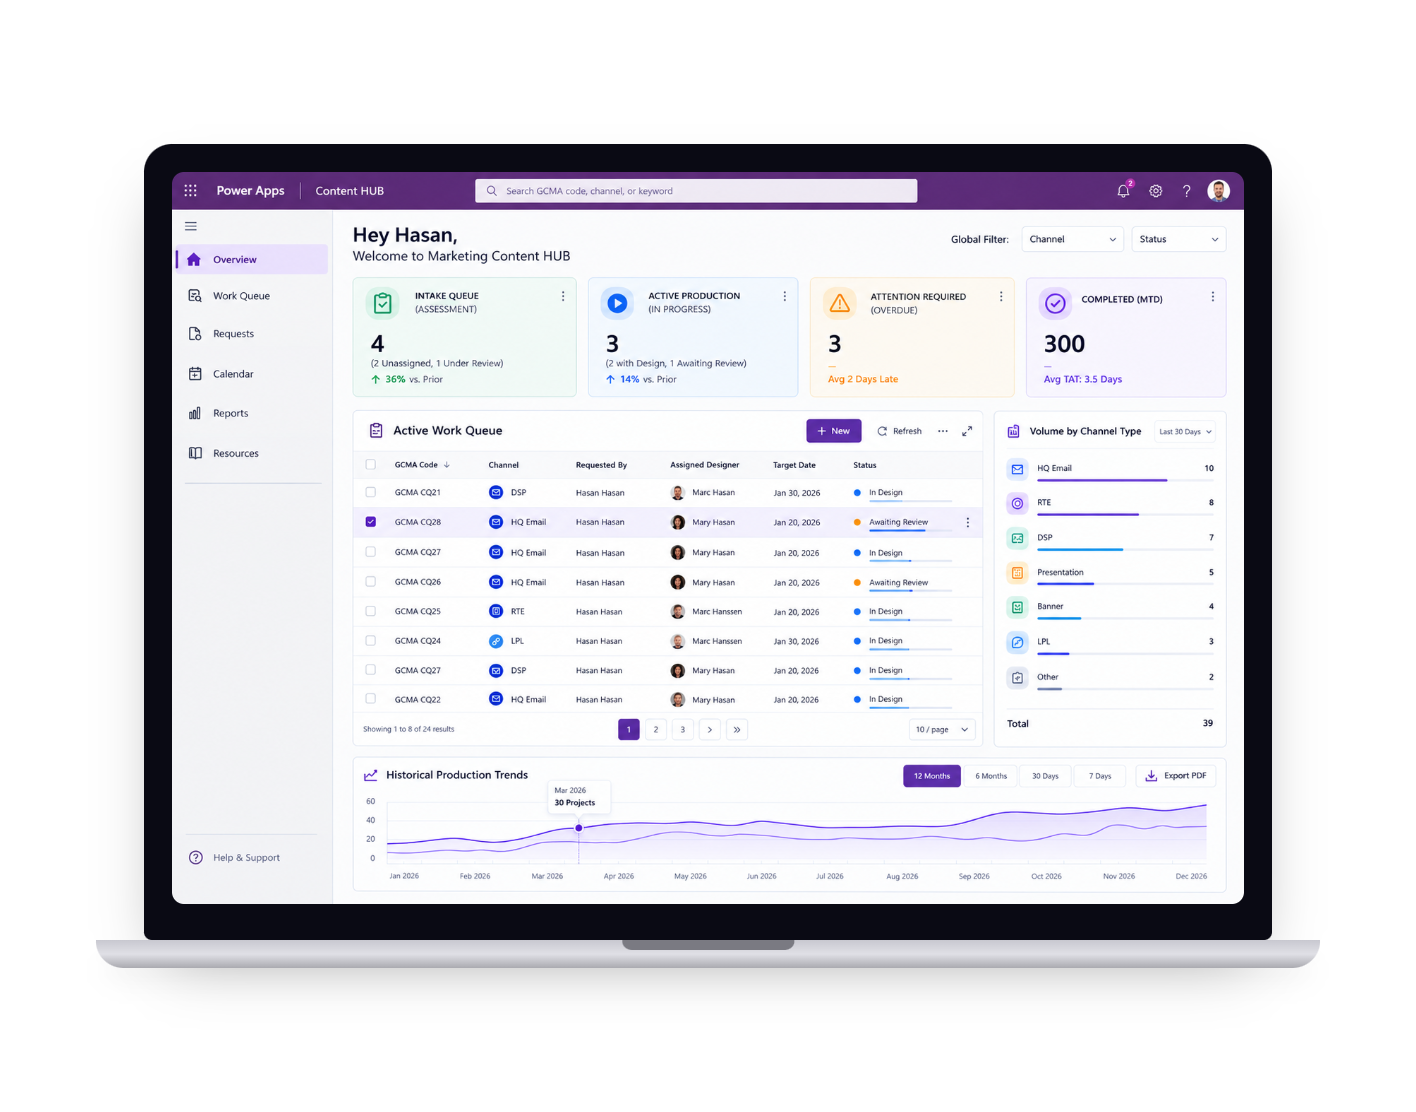
01 · Overview
The problem
Request and handover processes lacked visibility into team workload, operational performance, and delivery timelines. Communication lived across scattered emails and disconnected spreadsheets.
Zero central visibility
Stakeholders could not track active ticket statuses or measure team capacity, causing unpredictable bottlenecks.
Manual handover delays
Project folder creation, due date estimation, and assignment alerts relied entirely on manual handoffs.
“This solution transformed our content operations into a data-driven, automated ecosystem, accelerating delivery and unlocking measurable business value.”
02 · Month-to-Date Performance
Operational baseline
By consolidating live data into a centralized hub, we surfaced clear workload distributions and fulfillment velocity across all production channels.
Request distribution by status
- In Design: 120 requests (40%)
- Awaiting Review: 75 requests (25%)
- In Progress: 45 requests (15%)
- Handover: 30 requests (10%)
- Other: 30 requests (10%)
Delivery velocity
Delivery trends steadily accelerated through the month, peaking on January 20 with 56 deliveries dispatched in a single day thanks to automated batch handovers.
03 · Automation Engine
Workflows built into the system
We replaced friction-heavy administrative tasks with background automated triggers built with Microsoft Power Platform.
Active automations
- Dynamic project folder creation based on specific request criteria
- Automated calculation of proposed delivery dates
- Due date reminder triggers before project deadlines
- Instant team alerts when projects are assigned or delivered
- End-to-end workflow status tracking across queues
- Automated handover notifications to quality assurance
Planned AI & advanced triggers
- AI-assisted request classification and metadata auto-tagging
- Automatic workload balancing and skill-based task assignment
- Delivery risk prediction and SLA escalation alerts
- AI-generated project summaries for executive leadership
- Duplicate request identification and automated QC checks
- Deep Teams and Outlook notifications integration
04 · Impact
Business value generated
The platform set a new corporate benchmark, establishing full transparency while reducing unnecessary operational delays.
05 · Learnings
Takeaways
Visibility changes team culture
When everyone sees the same pipeline data, friction drops and cross-functional teams naturally align on priorities.
Automate mundane steps first
Automating folder setup, handoff alerts, and reminders frees significant time for higher-value creative production.
Design for executives & operators
A high-performing dashboard must serve both high-level leadership summaries and individual contributor work queues simultaneously.